VTM Dashboard Tab
The Dashboard tab shows the general information gathered as a result of the VTM service work for a particular client.
On the Dashboard tab, you can:
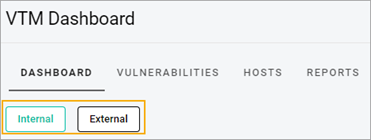
- Select the Internal or the External tab. Depending on the selected tab, you will see the data gathered as a result of the internal (on the Fortified’s scanners installed on a client side) or external (Uncredentialed scan on the client) scans correspondingly.

- Select the needed scan group (see Select Scan Group). Depending on the selected scan group, the data in the Total Vulnerabilities, Total Hosts, Authenticated Hosts, Vulnerabilities by Severity, Vulnerabilities Triage, Vulnerable Hosts, Vulnerabilities Breakdown, Top 10 Vulnerable Hosts, and Top 10 Unique Vulnerabilities sections will change.
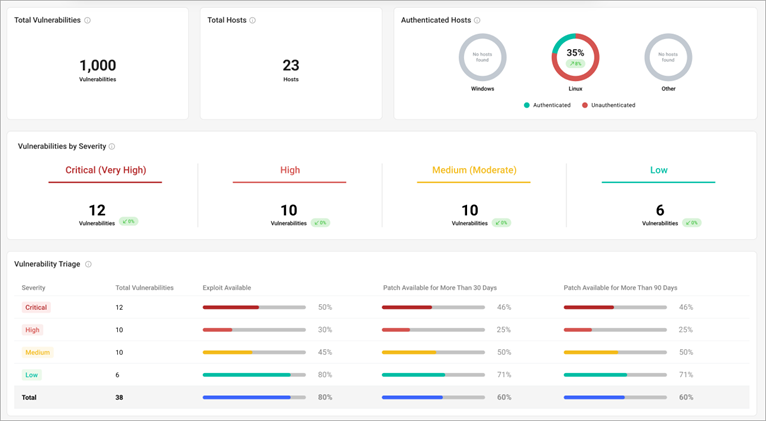
- View the Total Vulnerabilities, Total Hosts, Vulnerabilities by Severity, Vulnerabilities Triage sections that show general information about the VTM service data of a particular client within the selected scan group.

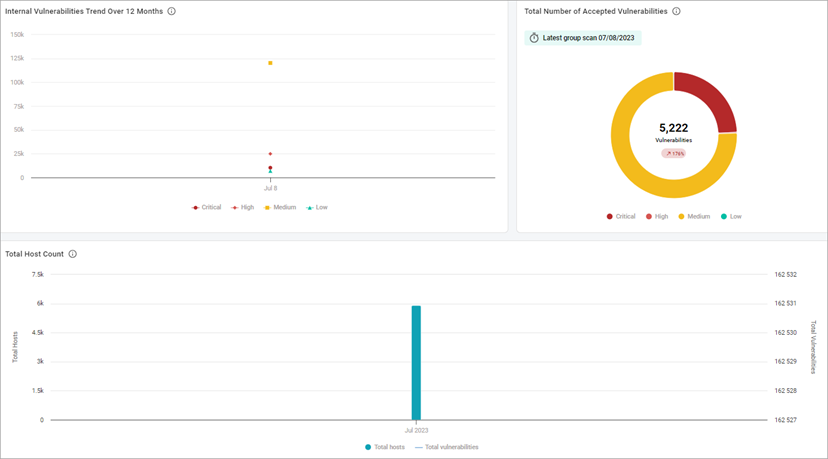
- View the Internal Vulnerabilities Trend Over 12 Months VTM, Total Number of Suppressed Vulnerabilities VTM, and Total Host Count charts.

- View the Vulnerable Hosts or the Vulnerabilities Breakdown sections depending on the selected option and within the selected scan group.

- View the Top 10 Vulnerable Hosts or Top 10 Unique Vulnerabilities sections data depending on the selected option and within the selected scan group.

- Note: To get the data from the VTM dashboard in .pdf format, in the upper-left corner of the page, select the Generate report button. You will get the notification once the report is available for you to download.
Related Topics
Total Vulnerabilities, Total Hosts, Vulnerabilities by Severity Sections
Vulnerabilities Breakdown Section
Top 10 Vulnerable Hosts Section
Top 10 Unique Vulnerabilities Section