XDR Dashboard Tab
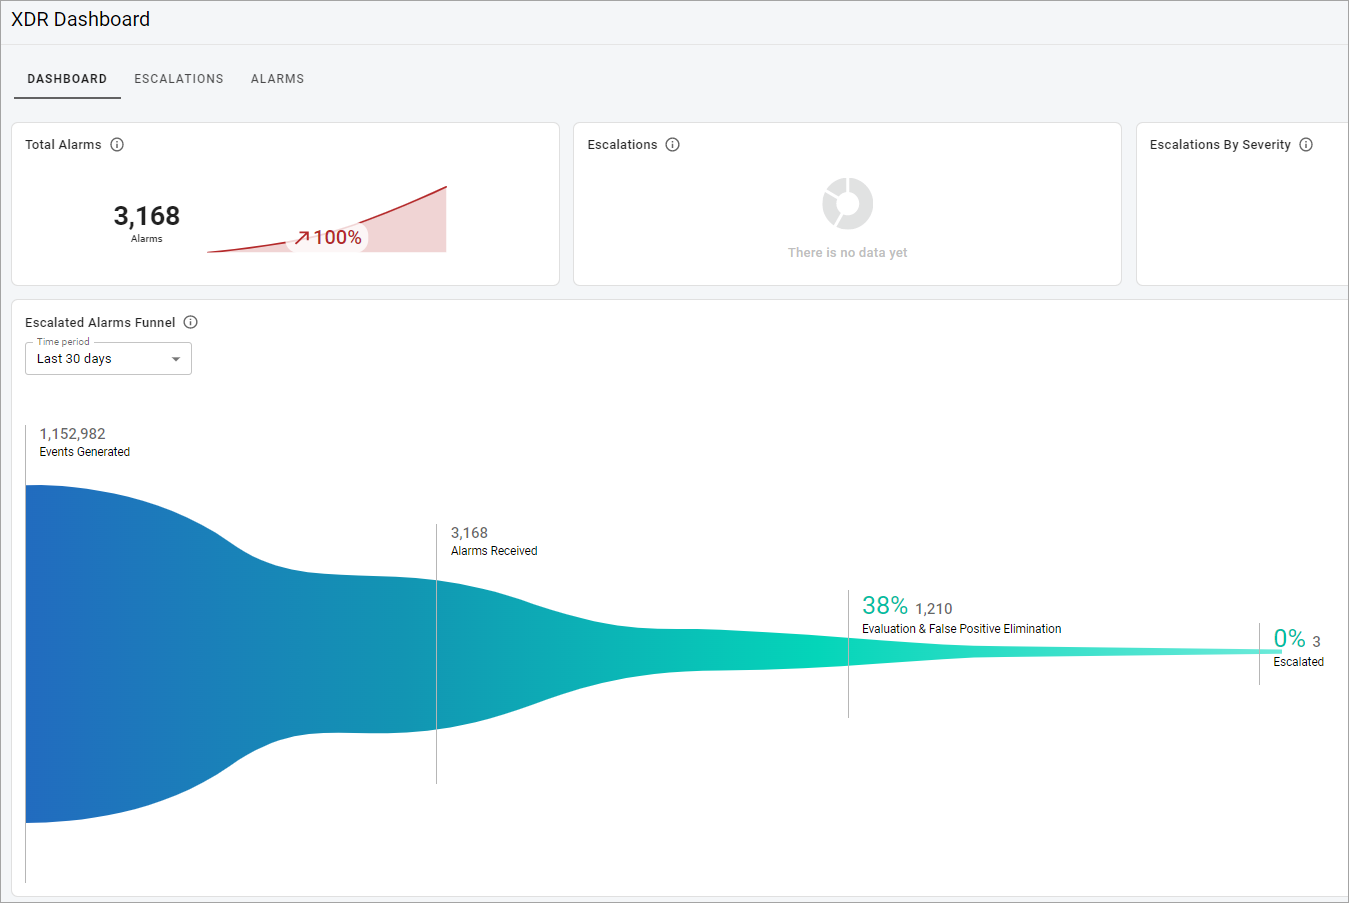
The Dashboard tab displays the following metrics:

- Total Alarms—shows the total number of alarms generated by suspected malicious operations in the last 30 days along with a 90-day trend for reference.
- Escalations—shows the total number of escalations received in the last 30 days along with a 90-day trend for reference.
- Escalations by Severity—shows a breakdown by severity of the escalations received in the last 30 days.
- Escalated Alarms Funnel—shows the number of events received, alarms generated from those events, followed by the number of alarms investigated by our Cybersecurity Operations Center, and finally the number of escalations that were created from those alarms.
- Recent Escalations—shows the 5 most recent XDR escalations, in no specific timeframe. Each escalation also displays the following information:
- The number of escalations of this type received in the last 30 days.
- The percentage of increase or decrease in volume for this escalation in the last 30 days compared to 31-60 days.
- The percentage of all escalations this type makes up.
- The mean time it takes your organization to resolve this escalation type.
- Client Investigation Hours Saved—shows the estimated number of client hours of investigation time saved by our analyst based on the number of alarms that they investigated over the last 30 days, as well as a 90-day trend that data point.
- Client Mean Time to Acknowledge (MTTA)—shows a comparison of the client’s average mean time to acknowledge (MTTA) escalations for the last 30 days (along with a 90-day trend of that datapoint) to the average of the same data across the Fortified Ecosystem.
- Client Mean Time to Resolve (MTTR)—shows a comparison of your average mean time to resolve (MTTR) escalations for the last 30 days, along with a 90-day trend of that datapoint to the average of the same data across the Fortified Ecosystem.
- Alarms by Intent—shows a breakdown by intent of alarms received in the selected time period.
- Alarms by Method—shows a breakdown by method of alarms received in the selected time period.
- Alarms and Events Trend—shows a trend for events ingested, total alarms generated and unsuppressed alarms for the selected time period.
- Outdated Sensors—shows the number of machines running an outdated version of the SentinelOne agent along with the percentage of your total machines that represents.
- Machines by Status—shows the number of machines in each status. Status definitions:
- Active—includes both online and offline machines.
- Stale—includes machines that have been offline for an extended period of time.
- Archived—includes machines that have been stale for an extended period of time.
- Alarms Trend Over 12 Month—shows the number of alarms generated by malicious operations trended by month.
- Machines by OS Type—shows the total number of devices along with what percentage belong to each OS type.
- Top 10 Alarms by Detection Type—shows the top 10 detection types along with the number of the alarms generated by malicious operations categorized in each detection type.
- Note: To get the data from the XDR dashboard in .pdf format, in the upper-left corner of the page, select the Generate report button. You will get the notification once the report is available for you to download.
Related Topics