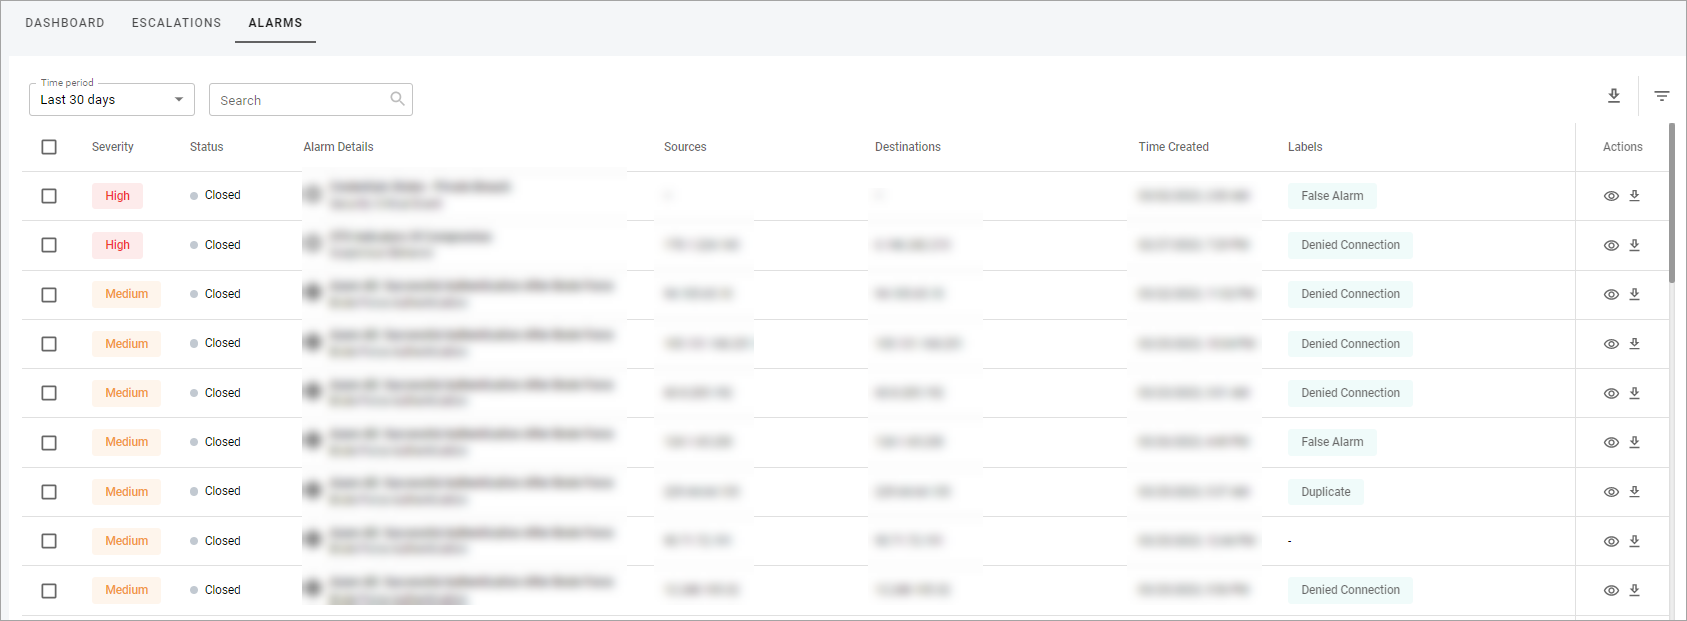
XDR Alarms Tab
The Alarms tab shows all the XDR alarms. You can use the Time period dropdown list to filter the alarms by Last 90 days, Last 30 days, Previous month, Last 7 days, Last 24 hours, or Last hour. You can also search the alarms by entering at least three characters of Alarm Details data, download a specific alarm, and filter alarms by Severity, Alarm Details by intent, and Alarm labels.
The Alarms tab contains a table with the following columns:

- Severity—a categorization of the risk and urgency of an alarm (High, Medium, or Low).
- Status—a current status of the alarm (Open or Closed).
- Alarms Details—information about an attack intent, strategy, and method.
- Sources—a host name or IP address of the source for an event creating the alarm.
- Destinations—a host name or IP address of the destination that received the events generating the alarm.
- Time Created—the time when an alarm was created.
- Labels—False Alarm, Client Contacted, Normal Activity, Denied Connection, Created Suppression Rule, Duplicate, Threat Remediated.
- Actions—shows the available actions you can perform on the Alarms tab, such as:
- View details—view the details of the alarm and read the communication thread.
- Download—select the checkbox near the alarm to download the alarm with details.
- Note: XDR Alarms that have unanswered questions are located at the top of the table and are highlighted in green.
Related Topics