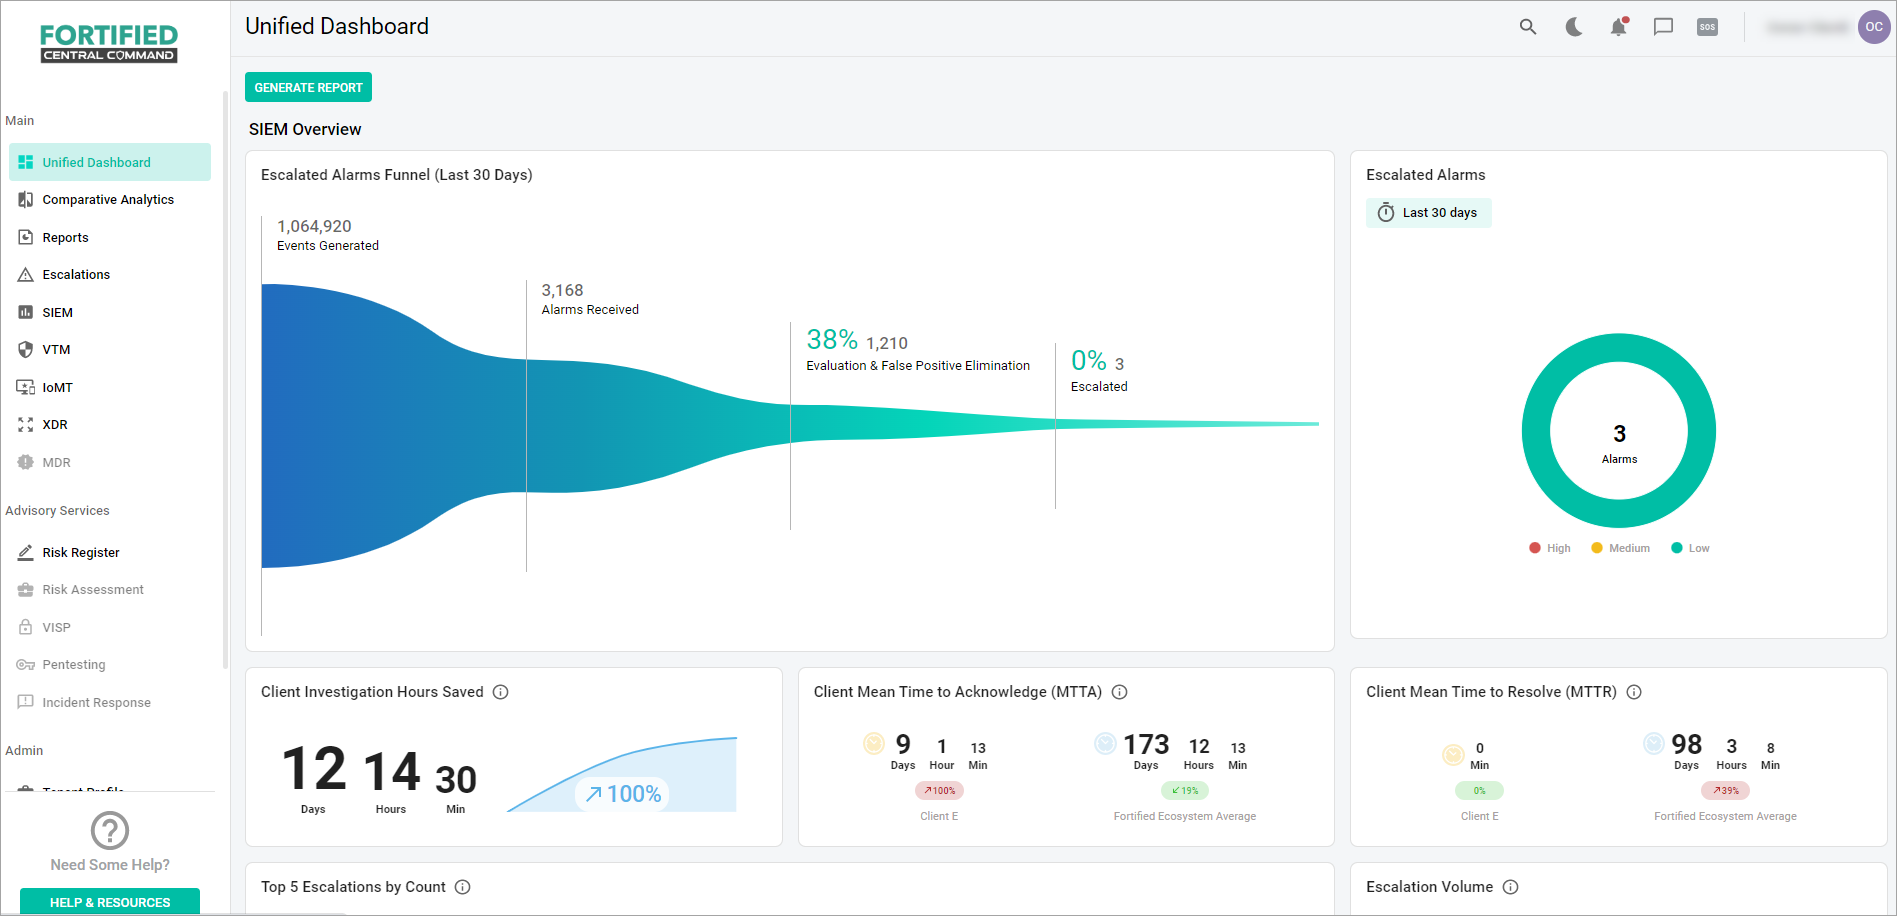
Unified Dashboard Page
The Unified Dashboard page shows the following:
- Generalized graphical information about each ordered service of a particular client (the SIEM Overview, VTM Overview, IoMT Overview, MDR Overview, XDR Overview, IR Program Overview, Risk Assessment Overview, Risk Register Overview sections).
- Note: If the service is enabled, but there is no data to display, you will see the empty state message and once the metrics are ready, they will be displayed on the dashboard.
- The Unlock Service Insights sections (for the services that are not ordered by the client).

For the Fortified Client Users, the Unified Dashboard page opens as the default page after the login (see User Roles and Permissions).
Related Topics
Left-Side Menu (Client Access)