MDR Dashboard Tab
The Dashboard tab contains general information on the Total Alarms and Suspicious Attacks Blocked. Also, it contains the following metrics:

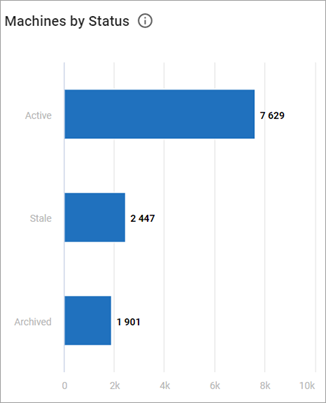
- Machines by Status—shows the number of machines in each status (Active includes both online and offline machines. Stale includes machines that have been offline for an extended period of time. Archived includes machines that have been stale for an extended period of time).
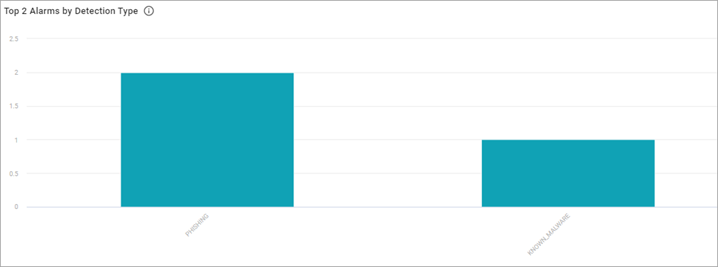
- Top Alarms by Detection Type—shows the top 10 detection types along with the number of the alarms generated by malicious operations categorized in each detection type.
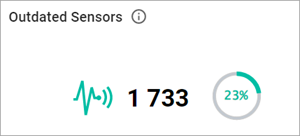
- Outdated Sensors—shows the number of machines running an outdated version of the MDR agent and the percentage of your total machines.
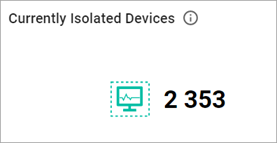
- Currently Isolated Devices—shows the number of machines that are currently in an isolated state.
- Note: Isolating an infected machine from the rest of the network ensures that it does not spread possible threats or infections. Once a machine is isolated, it remains isolated until you either reconnect it to the network or remove the machine from the server. When you isolate a machine, incoming and outgoing communication ports are disabled, except for communications by the MDR sensor processes and user-defined exceptions.
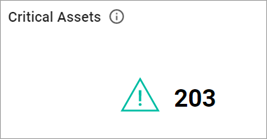
- Critical Assets—shows the number of critical assets where the installed sensor version is outdated or in offline status.
- Top Escalations by Count—shows the most recent MDR escalations, in no specific timeframe. Each escalation also displays the following information:
- The number of escalations of this type received in the last 30 days.
- The percentage of increase or decrease in volume for this escalation in the last 30 days compared to 31-60 days.
- The percentage of all escalations this type makes up.
- The average time it takes your organization to resolve this escalation type.

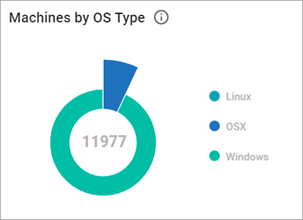
- Machines by OS type—shows the total number of devices along with what percentage belong to each OS type.
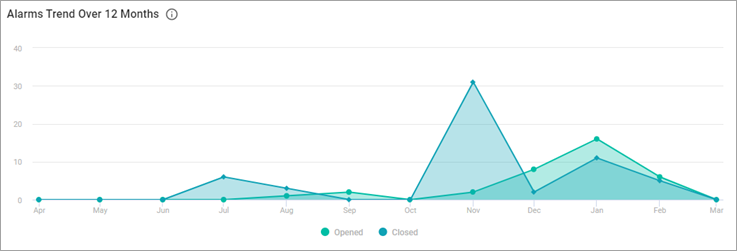
- Alarms Trend Over 12 Months—shows the number of alarms generated by malicious operations trended by month.
- Note: To get the data from the MDR dashboard in .pdf format, in the upper-left corner of the page, select the Generate report button. You will get the notification once the report is available for you to download.
Related Topics