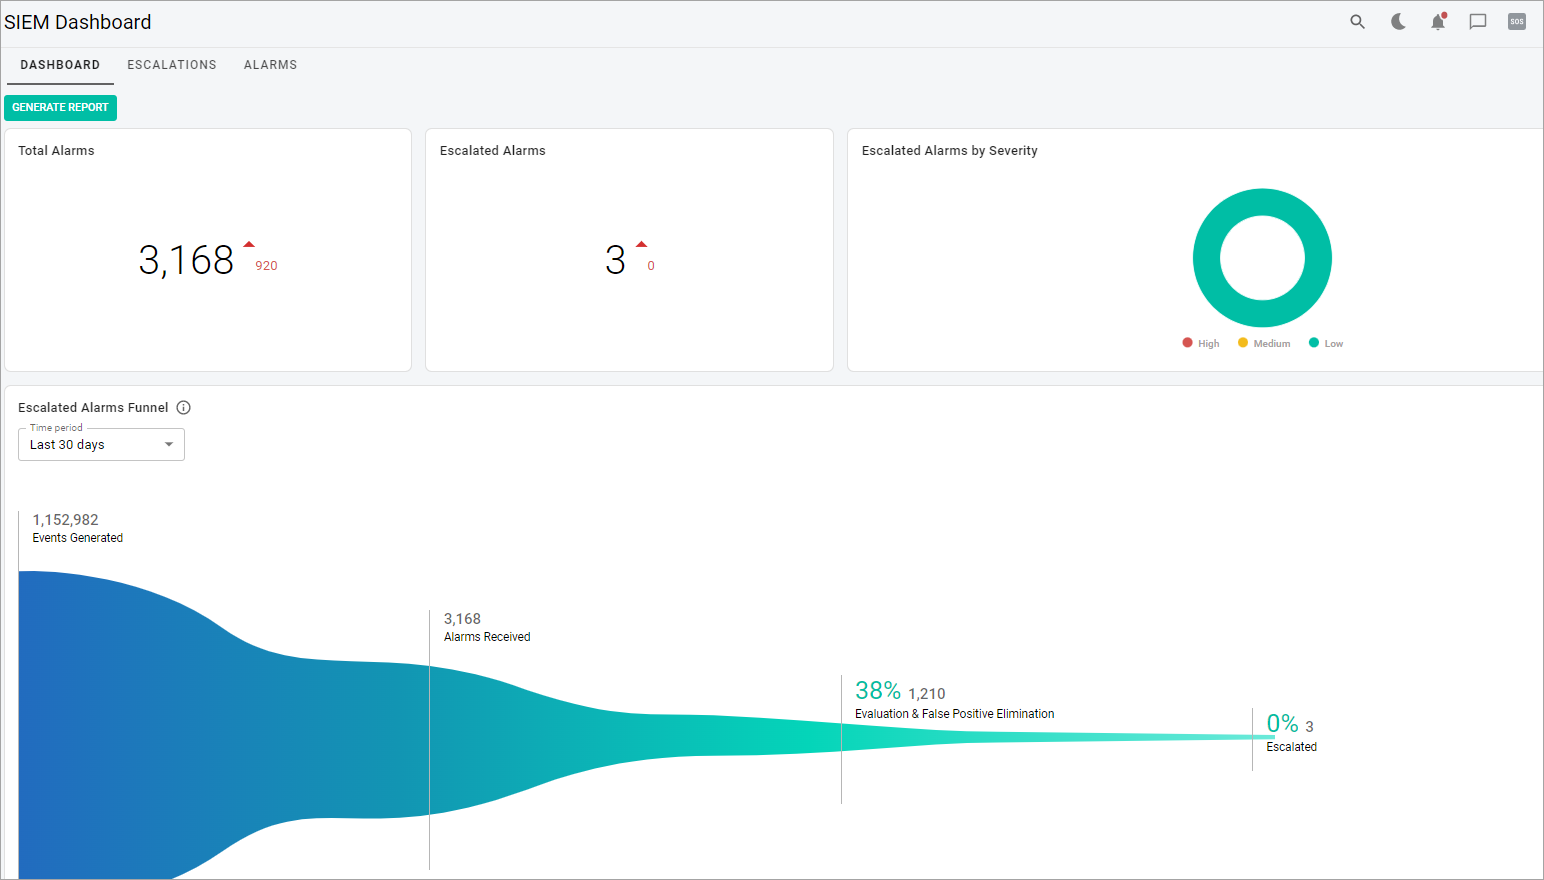
SIEM Dashboard Tab
The Dashboard tab displays the following metrics:

- Total Alarms—total number of alarms.
- Escalated Alarms—total number of escalated alarms.
- Escalated Alarms by Severity—a breakdown by severity of the escalated alarms in the last 30 days.
- Escalated Alarms Funnel—alarms and events for last 30 days compared to previous month.
- Alarms by Intent—breakdown of alarms by Intent Category.
- Alarms by Method—breakdown of alarms by Method Category.
- Alarms & Events Trend—trending chart for events ingested, total alarms generated and unsuppressed alarms.
- Top 10 Escalated Alarms—top 10 escalated alarms for the last 30 days, sorted by priority.
- Note: To get the data from the SIEM dashboard in .pdf format, in the upper-left corner of the page, select the Generate report button. You will get the notification once the report is available for you to download.
Related Topics